 Relevancy and Engagement
agclassroom.org/il/
Companion Resource

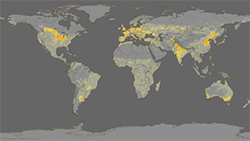
Crop Intensity Maps
The images on this site show crop intensity data (regions that produce the most crops), followed by the cropland products of 26 countries that produce 82% of the world's food. The final image shows the the population density in 2002 and the projected population in 2050.
URL
Author
NASA Scientific Visualization Studio
Lessons Associated with this Resource
- Agricultural Production Regions in the United States
- Filling the Global Grocery Bag
- Journey 2050 Lesson 5: Land Use (Grades 6-8)
- Journey 2050 Lesson 5: Land Use (Grades 9-12)
- Increasing Food Production with Precision Agriculture
- Global Trade and Interdependence
- Food Systems Feed the World
- Global Food Security